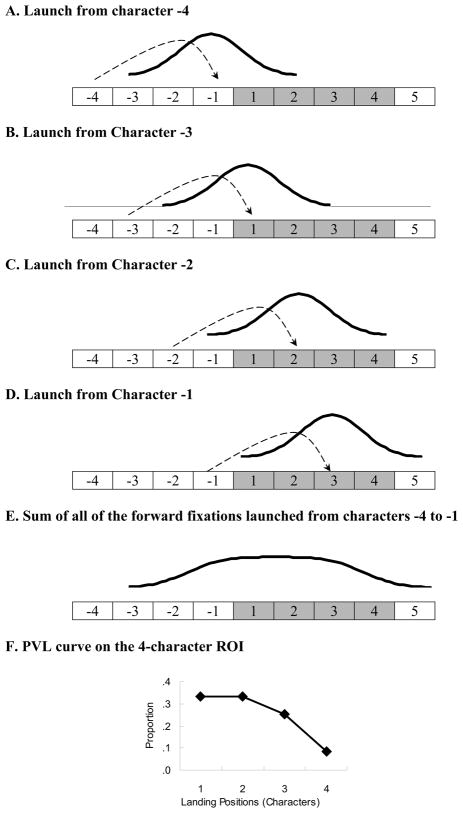
Figure 6.
A Hypothetical landing site distribution for Chinese words as a function of the launch site. Panels A–D represent the landing site distribution when saccades were launched from 4, 3, 2 or 1 characters to the left of the RO). The landing site distributions are approximately Gaussian in shape (with a mean of 2.6 characters and a standard deviation of 0.7 characters). The ROI is shaded in the boxes. Panel E represents the landing site distribution of all of the forward saccades launched from the four characters to the left of the ROI. Panel F is the PVL curve calculated from the landing site distribution shown in Panel E. The unit in the horizontal axis is based on characters, and all of the fixations landing on a character were counted. Note that the data in this figure are from a simulation.

