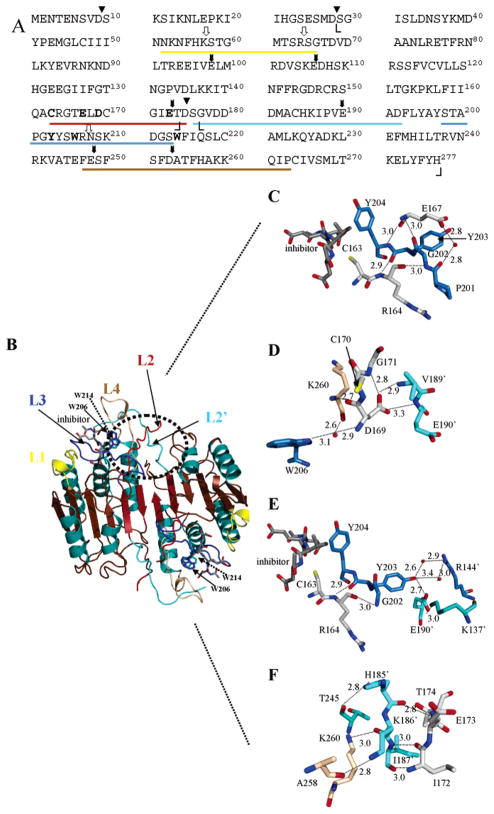
Figure 1.
Structure of caspase-3 and loop bundle interactions. (A) Primary sequence of human procaspase-3. Amino acid residues in L1 (52–66), L2 (163–175), L3 (198–213), L4 (247–263), and L2′ (176′–192′) are underlined, and the colors correspond to those in panel B. Cleavage sites for trypsin (white arrows) and V8 proteases (black arrows) are shown. The catalytic cysteine (C163), two tryptophans (W206 and W214), and amino acids in the loop bundle (E167, E169, E173, and Y203) are shown in bold. Boundaries observed in the crystal structures for the large subunit (S29–D175) and the small subunit (G177–H277) are indicated by angle brackets. Processing sites in the procaspase (D9, D28, and D175) are denoted with triangles. (B) Mature caspase-3 was generated with PyMOL (Delano Scientific, San Carlos, CA). The positions of L1–L4 and the active site tryptophan residues (W206 and W214) are indicated. (C) The position of E167 is highlighted relative to the active site and residues in L3. (D) Hydrogen bonds contributed by D169 to residues in L4 (brown) and L2′ (cyan) are highlighted. (E) The position of Y203 relative to the second heterodimer (R144′, E190′, and K137′) and L2 (C163 and R164) is highlighted. (F) Contacts between L2′ (cyan) and L4 (brown) are shown for residues near E173. For panels C–F, colors for L1–L4 are the same as those for panel B except for L2. For clarity, residues in this loop are colored gray in panels C–F. Red spheres represent water molecules. The small numbers represent distances (in angstroms) between two atoms connected by the dashed lines, and the primes denote residues in the second monomer.

