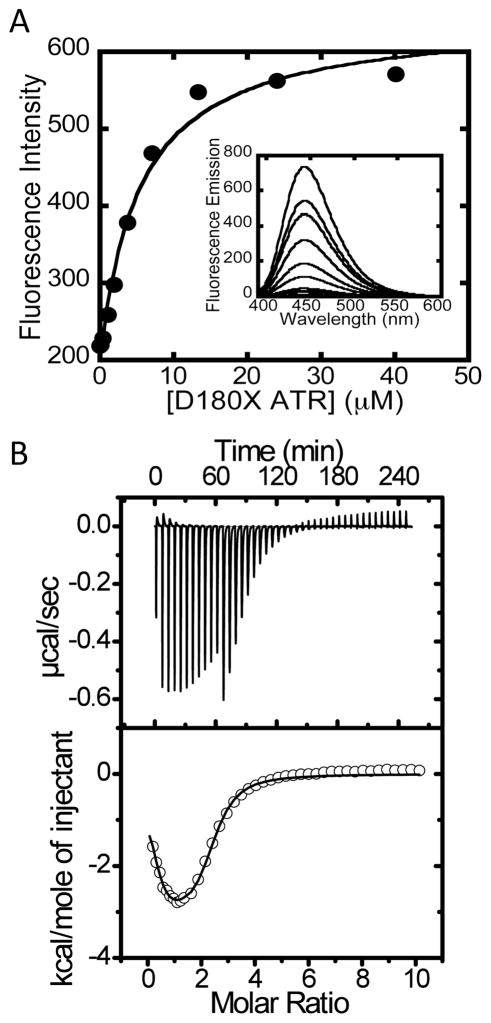
Figure 5.
Binding of ATP to D180X ATR. (A) The inset shows a representative fluorescence titration of MANT-ATP (15 μM) with D180X ATR (0–40 μM) at 10 °C. (B) Representative calorimetric titration data for binding of ATP to ATR (50 μM) in Buffer B at 4 °C. The top panel depicts the raw data for ATP-binding in power versus time. The lower panel shows integration of data in the top panel, which is proportional to the heat release that accompanies binding as a function of time. The data in the lower panel were best fit to a two-sites binding model and yielded the thermodynamic parameters that govern ATP binding to D180X ATR at 4 °C (shown in Table 2).

