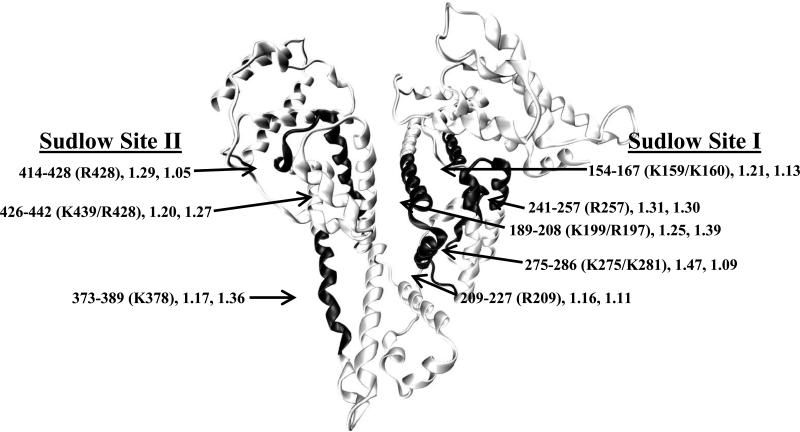
Figure 6.
Locations of regions on HSA that gave high values for the glycated/control index and that occurred near Sudlow sites I and II. This image was generated using the crystal structure of HSA [41] and Visual Molecular Dynamics software [42]. This structure includes information on the region of HSA that is being modified, the specific residues that were most likely modified in this region [34], and the glycated/control index values for this regions in the glycated HSA samples after two or five weeks of incubation.

