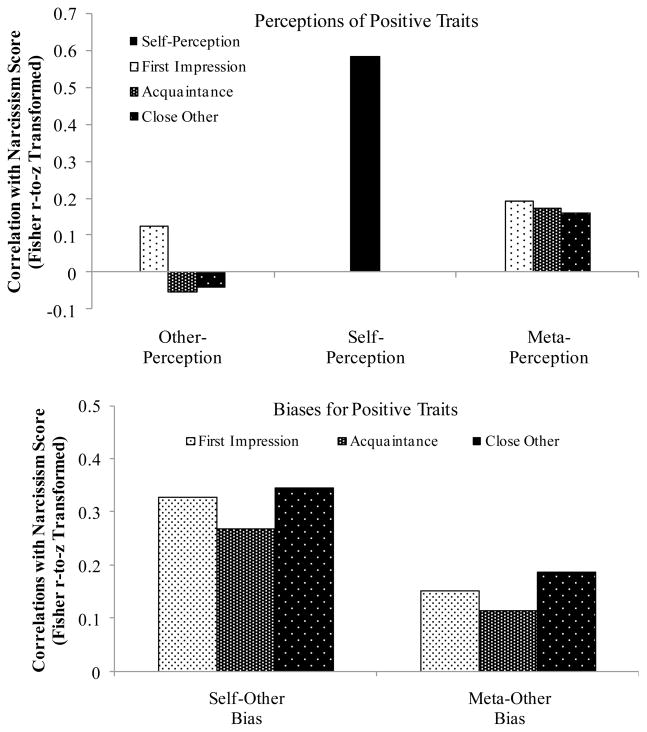
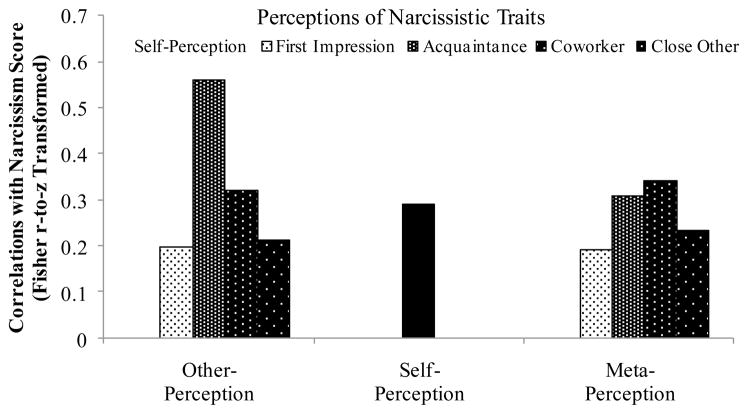
Figure 2.
A mini meta-analysis of results across three studies. The top panel reflects the average correlations between narcissism scores and perceptions (self-, meta-, and other-perceptions) of positive traits (e.g., intelligent). The middle panel reflects the average correlations between narcissism scores and self-other bias (positivity of self-perceptions relative to others’ perceptions) and meta-other bias (positivity of meta-perceptions relative to others’ perceptions) for positive traits. The bottom panel reflects the average correlations between narcissism scores and perceptions of narcissistic traits (e.g., arrogant).


