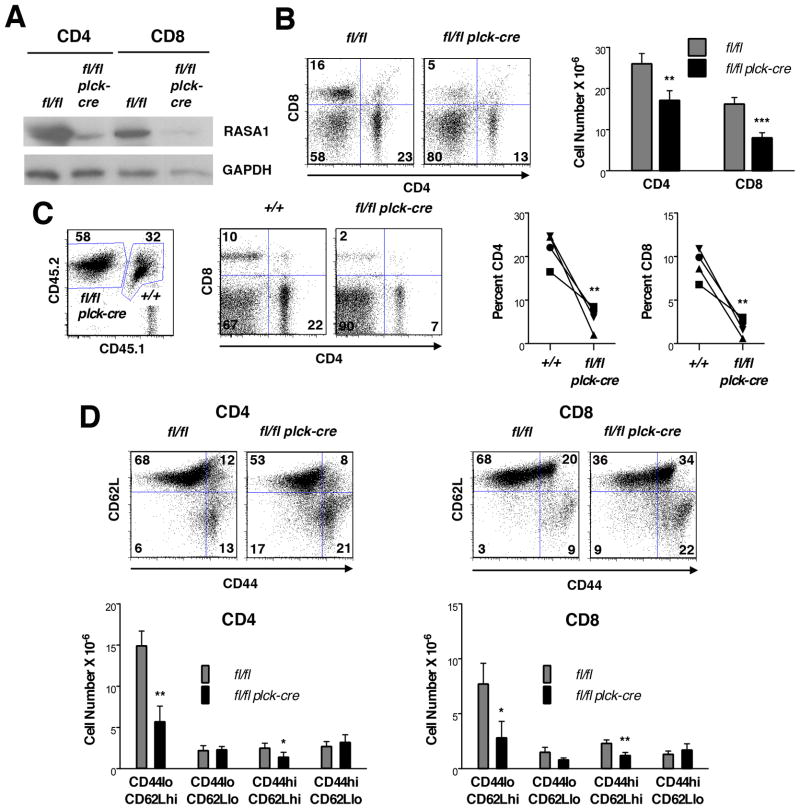
FIGURE 6. Peripheral T cells in T cell-specific RASA1-deficient mice.
(A) Representative Western blot showing expression of RASA1 in CD4 and CD8 T cells isolated from spleens of littermate rasa1fl/fl and rasa1fl/fl plck-cre mice. (B) Representative flow cytometry plots of CD4 and CD8 expression (left) and mean number + 1 SEM of CD4 and CD8 T cells (right) in spleens of littermate rasa1fl/fl and rasa1fl/fl plck-cre mice (n=16 mice each genotype). (C) BM from rasa1fl/fl plck-cre (CD45.2) and wild type C57BL/6 (+/+) (CD45.1/CD45.2) mice was adoptively transferred to lethally-irradiated wild type C57BL/6 (CD45.1) recipients. Flow cytometric plots show CD45, CD4 and CD8 expression in a single representative recipient spleen 6 wk after BM transfer. Numbers in CD45 plots indicate percentage of splenocytes of donor wild type or rasa1fl/fl plck-cre origin among total splenocytes. Numbers in CD4/CD8 plots indicate percentage of cells in quadrants among splenocytes of the indicated genotype. Line graphs summarize results from 4 independent recipient mice. Percent CD4 and CD8 T cells among splenocytes of the indicated genotypes are shown. Alike symbols are used to represent data obtained from the same mouse within and between graphs. (D) At top are shown representative flow cytometry plots of CD44 and CD62L expression upon CD4 and CD8 T cells in spleens of littermate rasa1fl/fl and rasa1fl/fl plck-cre mice. Corresponding bar graphs below show mean cell number +1 SEM of the indicated splenic subpopulations (rasa1fl/fl, n=6; rasa1fl/fl plck-cre, n=7). Statistical significance was determined using unpaired (B and D) and paired (C) Students’ t-tests.

