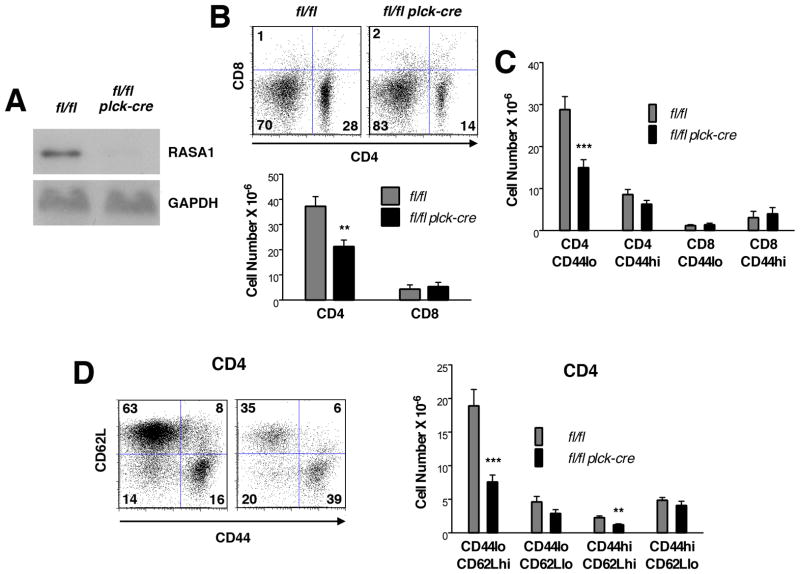
FIGURE 8. Peripheral T cells in T cell-specific RASA1-deficient AND TCR Tg mice.
All analyses were performed upon splenocytes or splenic T cells of littermate rasa1fl/fl and rasa1fl/fl plck-cre AND TCR Tg mice. (A) Representative Western blot showing expression of RASA1 in purified CD4 splenic T cells from AND TCR Tg mice. (B) At top are shown representative flow cytometry plots of CD4 and CD8 expression in AND TCR Tg spleens. Bar graph below depicts mean cell number + 1 SEM of CD4 and CD8 splenic T cells (n=13 mice each genotype). (C) Bar graph shows mean number + 1 SEM of indicated CD4 and CD8 subpopulations in AND TCR Tg spleens (n=13 mice each genotype). (D) At left are shown representative histograms of CD44 and CD62L staining upon CD4+ T cells in AND TCR Tg spleens. Bar graph at right shows mean number + 1 SEM of the indicated CD4+ populations (n=8 each genotype). Statistical significance was determined using the Student’s two-sample t-test.

