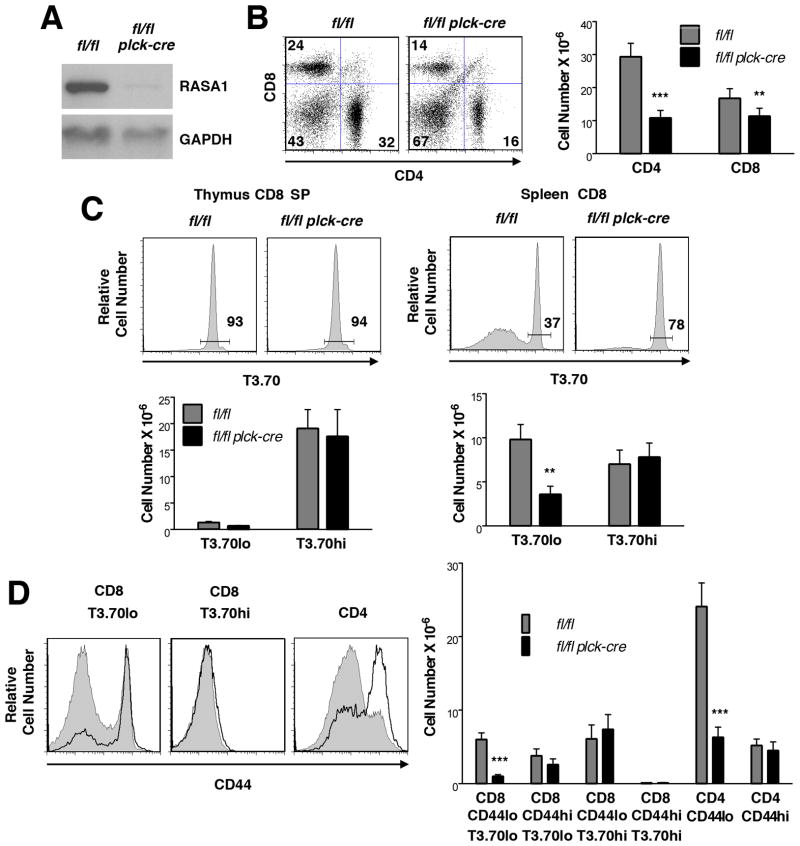
FIGURE 9. Peripheral T cells in T cell-specific RASA1-deficient female HY TCR Tg mice.
All analyses were performed upon splenocytes or splenic T cells or thymocytes of littermate rasa1fl/fl and rasa1fl/fl plck-cre female HY TCR Tg mice. (A) Representative Western blot showing expression of RASA1 in purified CD8 splenic T cells from female HY TCR Tg mice. (B) Representative flow cytometric plots of CD4 and CD8 expression (left) and mean number + 1 SEM of CD4 and CD8 T cells (right) in spleens of female HY TCR Tg mice (rasa1fl/fl, n=8; rasa1fl/fl plck-cre, n=9). (C) Representative histograms at top show expression of the T3.70 marker upon thymic CD8 SP T cells and splenic CD8 T cells of female HY TCR mice. Percentages of CD8 T cells that express the HY TCR (T3.70hi cells) are indicated. Bar graphs below shown mean number + 1 SEM of the indicated thymic CD8 SP and splenic CD8 T cell populations (rasa1fl/fl, n=8; rasa1fl/fl plck-cre, n=9). (D) Histograms at left show representative expression of CD44 upon the indicated splenic T cell populations of female HY TCR Tg mice. Filled and bold histograms represent rasa1fl/fl and rasa1fl/fl plck-cre mice respectively. Bar graph at right shows mean number +1 SEM of the indicated populations in spleens (rasa1fl/fl, n=8; rasa1fl/fl plck-cre, n=9). Statistical significance was determined using the Student’s two-sample t-test.

