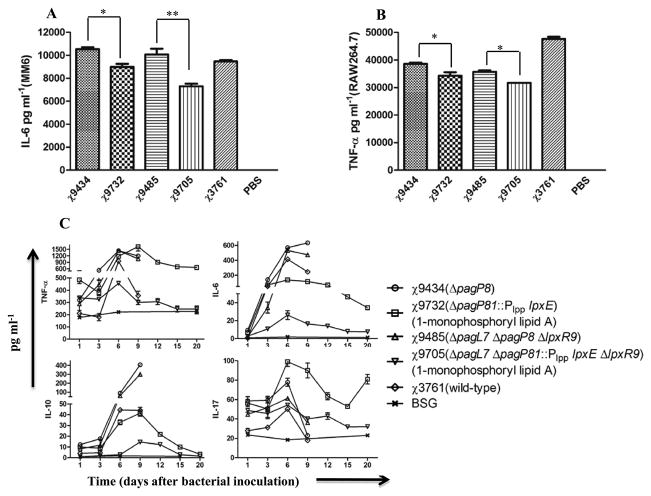
Figure 3.
Cytokine concentrations in tissue culture supernatants from cells stimulated by LPS and in sera from immunized mice. Supernatants from Mono Mac 6 human monocyte cell line (MM6) and RAW264.7 murine macrophages were collected 24 h after stimulation with 0.1 or 10 pmol/ml LPS and tested for the presence of human IL-6 in MM-6 (A) and murine TNF-α in RAW264.7 (B), respectively. Data represent the mean cytokine concentration from two independent assays. P values for all cytokine analyses were determined using one-way ANOVA followed by Dunnett’s multiple comparison test. The multiple bioplex cytokine assay was used to detect and quantitate the amount of each cytokine in pooled sera collected from mice (n = 3 mice/group) inoculated with χ3761 and its derivatives on different days (C). All mice in groups inoculated with strains χ9434, χ9485 and χ3761 succumbed to the infection by day 10. In the group inoculated with χ9732, one mouse died on day 12. All mice inoculated with χ9705 survived for the duration of the experiment. The error bars represent the Mean ± SEM

