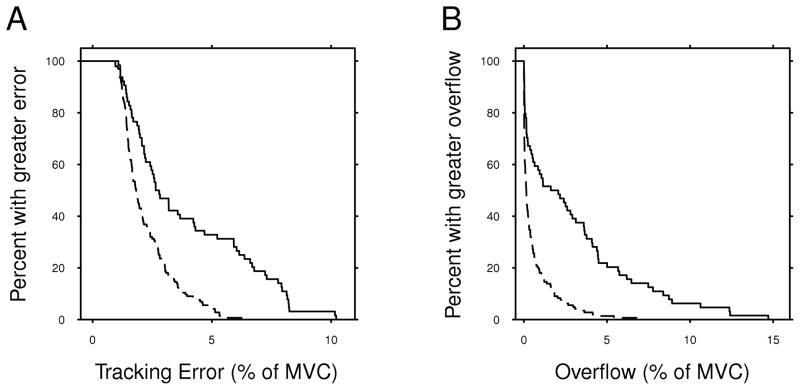
FIG. 3.
Kaplan-Meier plots showing mean tracking error (A) and overflow (B) in block 1 for individuals in the control (dashed line) and dystonic (solid line) groups. These plots illustrate the distribution of the measured values for each group, especially the difference between groups in the tails of the data.

