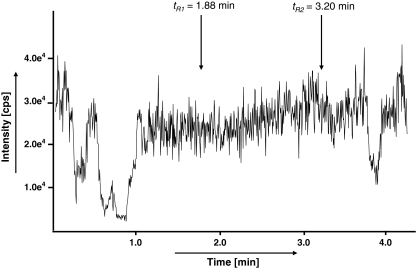
Fig. 2.
Post-column infusion chromatograms. Indicated by the arrows are the retention times of OSC t R1 = 1.88 min and OS t R2 = 3.20 min. The major drops in the XIC signal (for OS m/z 313+ → 225 and OSC m/z 285+ → 138) are due to ion suppression of eluting matrix compounds at the beginning of the gradient and due to a sudden change in solvent composition after ∼3.4 min

