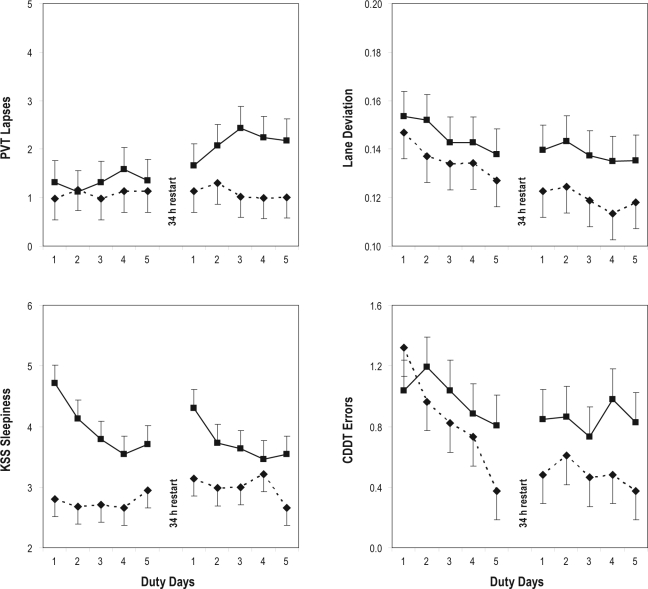
Figure 2.
Neurobehavioral performance during simulated duty days in the simulated nighttime duty (SND) experimental condition and the simulated daytime duty (SDD) control condition. The panels show group means (with standard errors) by duty day, collapsed over time of day, for the duty cycles before and after the 34-hour restart break. Boxes (solid lines) represent the SND condition; diamonds (dashed lines) represent the SDD condition. Top left: number of performance lapses on the psychomotor vigilance test (PVT). Top right: lane deviation (standard deviation of lane position), expressed in meters, in the straightaways during high-fidelity simulator driving. Bottom left: sleepiness score on the Karolinska Sleepiness Scale (KSS). Bottom right: number of error responses on the cardinal direction decision task (CDDT). Upwards on the ordinate indicates worse performance in each panel.

