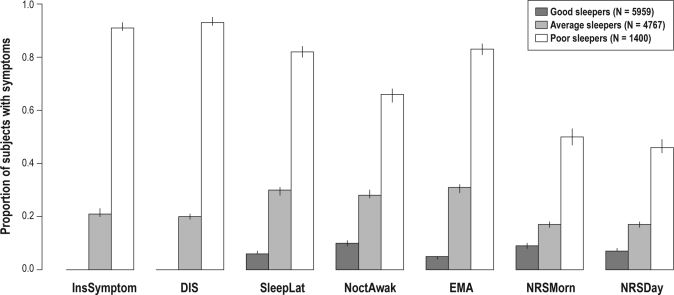
Figure 1.
Proportions (95% confidence intervals; y-axis range 0–1) of insomnia-related symptoms of the three sleeper categories in cluster analysis. This figure shows the proportions of those with insomnia symptoms in each of the three clusters when the response alternatives are dichotomized according to the mean responses of good sleepers. Low values indicate absence or infrequent occurrence of each symptom (in sleep latency short time) and high values increasing frequency of the symptom (long sleep latency) N = 12,126. InsSymptom, insomnia-symptom; DIS, difficulty in initiating sleep; SleepLat, sleep latency; NoctAwak, nocturnal awakenings; EMA, early morning awakening; NRSMorn, non-restorative sleep (morning); NRSDay, non-restorative sleep (day).

