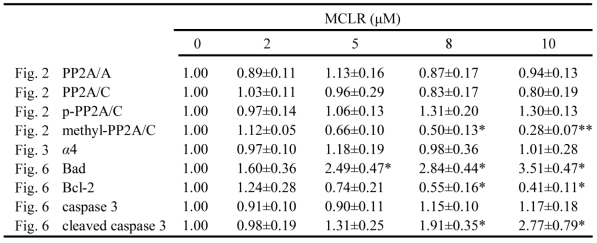
Table 1.
Protein levels of different proteins after MCLR treatment. Densitometric analysis was performed by Image J software. Results were expressed by mean ±SD from three independent experiments. The protein expression from control group was designated as 1 and the others were expressed as folds compared with the control. In case of multiple bands, the values represent all bands detected. The asterisk symbol represents statistical significance in comparison with the control value (*, p<0.05; **, p<0.01).

