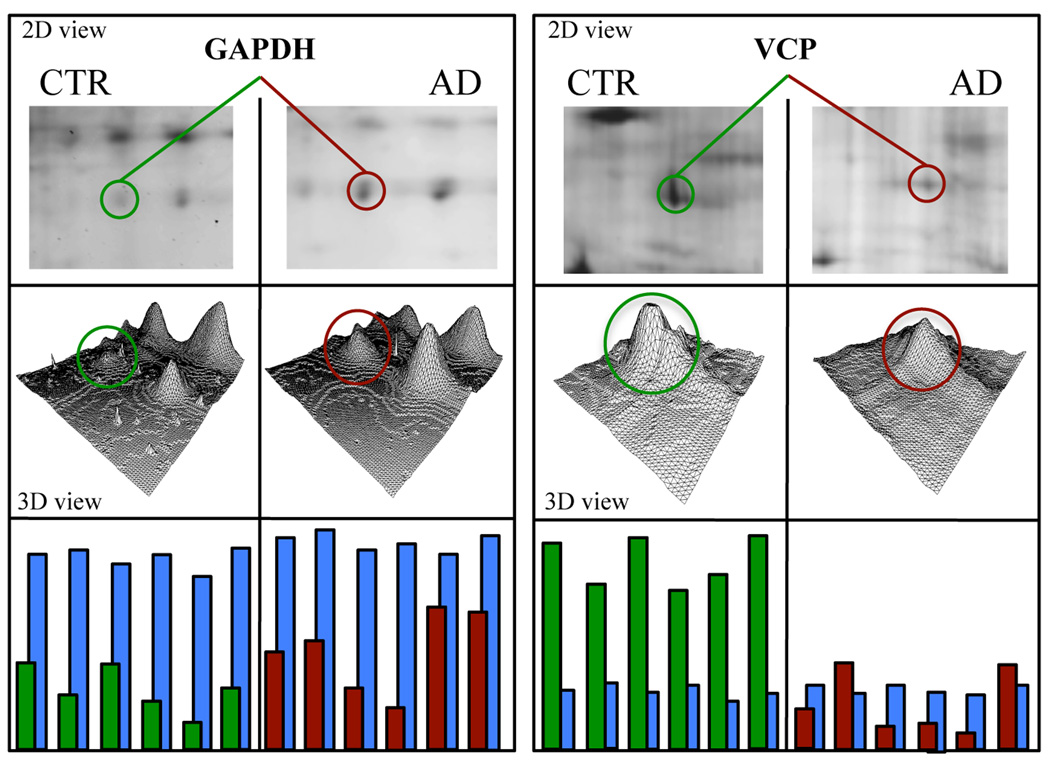
Figure 3.
Representative enlarged images of selected spots from CTR and AD hippocampus showing the altered phosphorylation of two selected proteins: GAPDH and tER ATPase. In the figure are shown the position of the respective protein spot in the gel in the 2D image, 3D density graphs elaborated by PD-Quest software, and the histograms with phosphorylation (green and red) and expression (blue) intensity bars of each of the 6 samples per group.

