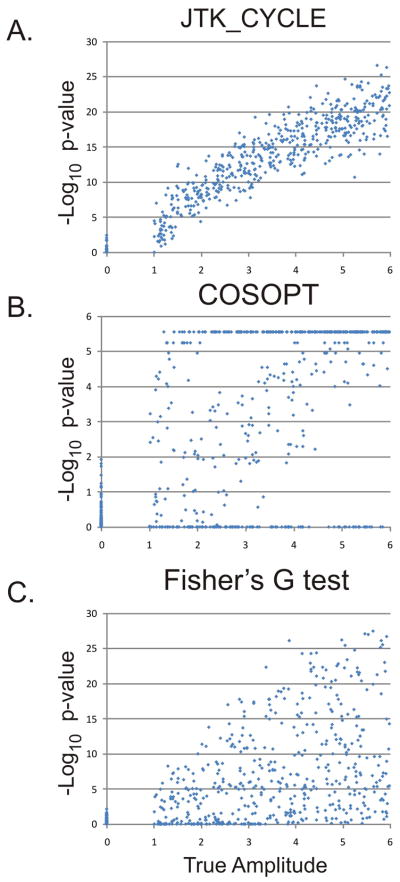
Figure 1. JTK_CYCLE reliably detects cycling transcripts.
To simulate circadian gene expression, a test set of 1024 ‘transcripts’ was randomly generated with 48 time points per transcript. Half of these transcripts were non-rhythmic with amplitudes equal to zero; the other half consisted of transcripts with amplitudes ranging from one (weakly rhythmic) to six (strongly rhythmic). JTK_CYCLE (A), COSOPT (B), and Fisher’s G-test (C) were used to analyze these data, and −Log 10 p-values were plotted as a function of the true amplitude. JTK_CYCLE reliably distinguished rhythmic from non-rhythmic transcripts; in comparison, COSOPT and Fisher’s G-test showed considerable overlap between the null-distribution and the true-positives.

