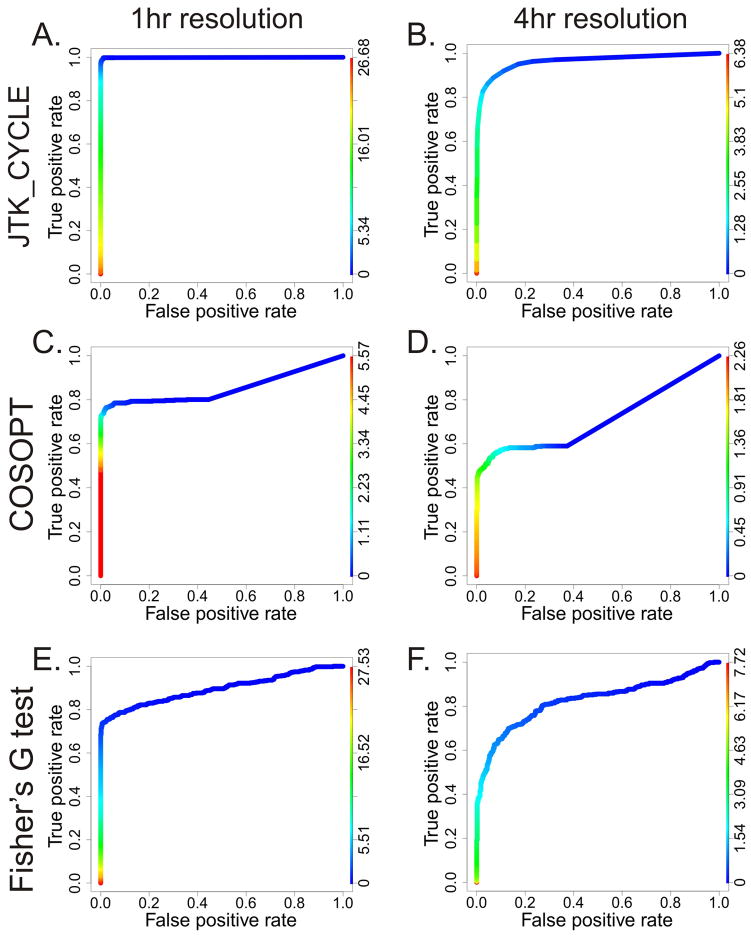
Figure 2. JTK_Cycle outperforms Fisher’s G-test and COSOPT at both 1-and 4-hour sampling resolutions.
Using the results from Figure 1, ROC plots were generated to visualize the sensitivity and specificity of JTK_Cycle (A, B), COSOPT (C, D) and Fisher’s G-test (E, F) at both one (left) and four (right) hour sampling resolutions. Color-coded lines represent −Log 10 p-values.

