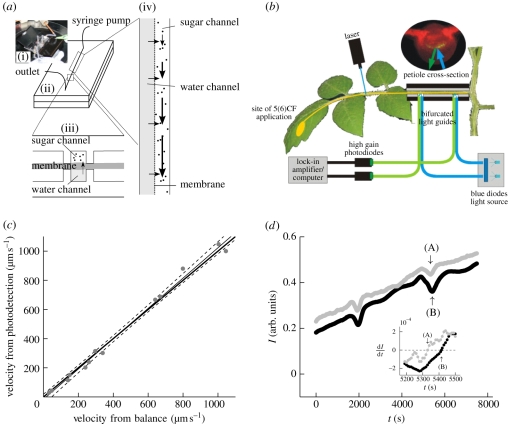
Figure 2.
(a) Microfluidic set-up. (i) Picture of the microfluidic device used to biomimic the phloem transport system. (ii,iii) Schematic of the microfluidic device. Two microchannels are in osmotic contact through a semi-permeable membrane. One, the bottom channel, remains filled with pure water while the other contains a sugar solution injected slowly at one end by a syringe pump. (iv) Close-up showing the flow mechanism driving sugar translocation in the microfluidic system. (b) Sketch of the set-up used to determine phloem flow rate in tomato petioles. (c) Comparison of flow velocities in a 1.19 mm diameter glass capillary determined by our photobleaching technique and by a standard mass flow-rate technique (filled circles, measurements; thin line, regression; dashed line, 95% confidence interval; thick line, one to one relation). (d) Two consecutive measurements of the relative intensity I of the fluorescence versus time t detected by the two photodiodes shown in (b). The flow velocity u is determined by measuring the traversal time between the two diodes, marked by arrows (A,B), of a minimum in I induced by photobleaching of the dye using a short (less than 30 s) laser pulse. The inset shows ∂I/∂t versus time; the intensity minima (indicated by arrows (A,B)) are given by ∂I/∂t = 0 (black circles, sensor 1; grey circles, sensor 2). (Online version in colour.)

