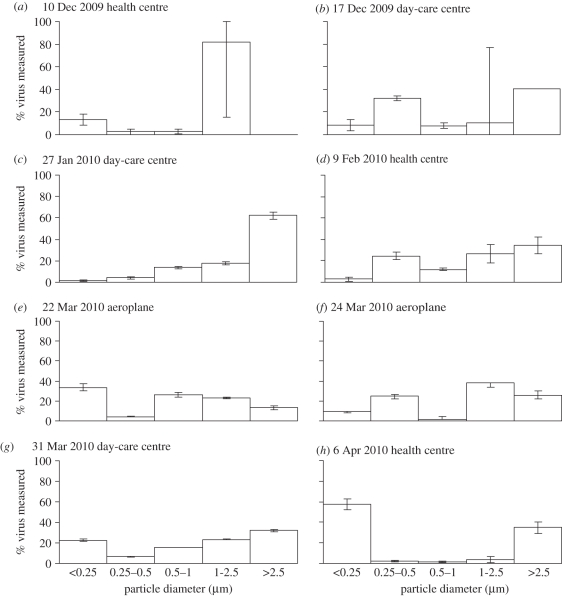
Figure 1.
Airborne IAV particle size distributions in each positive sample (date and location shown at top). Aerosol samples were collected over 6–8 h in each location using a cascade impactor with cut-point diameters of 0.25, 0.5, 1.0 and 2.5 µm. The y-axis indicates the percentage of total virus genome copies found in each size range. In seven of the eight cases, the majority of viruses were associated with fine particles smaller than 2.5 µm, which can remain suspended for hours, but there were no obvious trends in size distributions across different samples.

