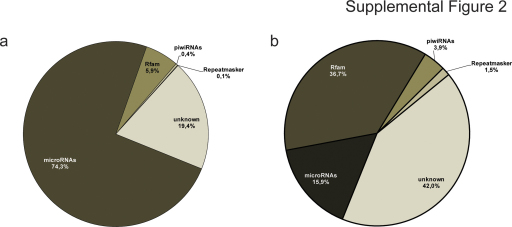
Supplemental Figure 2.
Comparison of total and unique read annotation as observed for Pool small RNAs. Pie charts were used for illustrating the distribution of read annotation as miRNA, Rfam ncRNA, piwiRNA (piRNA), repetitive rodent RNA, or unknown. Pie charts are given for the total read set (a) and the unique read set (b).

