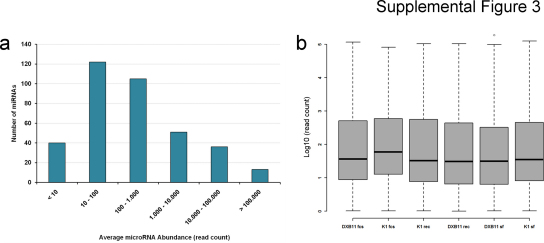
Supplemental Figure 3.
Quantitative analysis of miRNA transcription. The histogram plot in (a) shows that the majority of miRNAs exhibit read counts between 10 and 1.000. (b) Read counts were then normalized to the individual size of each library (in million read counts) and log10-transformed to achieved a Gaussian distribution of miRNA expression across all 6 CHO cell lines, visualized using a boxplot diagram.

