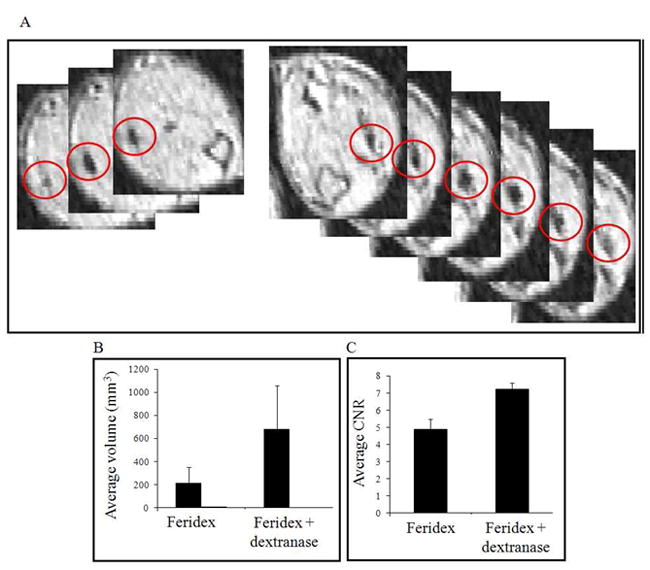
Figure 5.

In vivo REACTION, 24 hours after injection of labeled cells. A) Left, three slices from MRI of leg injected with cells labeled only with Feridex. Dark contrast regions are circled in red. Slices are separated by 156 microns. Right, six slices from MRI of leg injected with cells labeled with Feridex and dextranase. Dark contrast regions are circled in red. Slices are separated by 156 microns. B) Graph of measured volume of dark contrast regions and C) contrast to noise ratio from cells labeled with Feridex only or double labeled with Feridex and dextranase.
