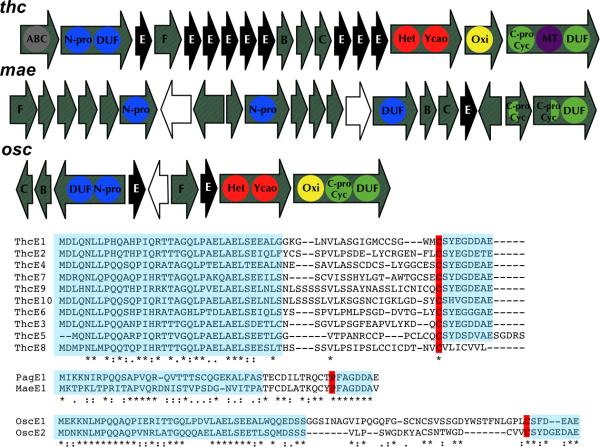
Figure 2. New Pathways by Genome Mining.
A. New gene clusters. Black: precursor peptides. Blue: N-terminal protease. Red: Heterocyclase. Light green: C-terminal protease / macrocyclase. Yellow: oxidase. White: transposon. The size of the pathways is not shown to the exact scale. B. Precursor peptide sequences from the new gene clusters. Highlighted sequences indicate the more conserved N- and C-termini of the peptides versus the hypervariable inner region. Residues highlighted in red indicate the predicted C-terminal cleavage site. Asterisks indicate 100% conservation among variants. See also Figure S3.

