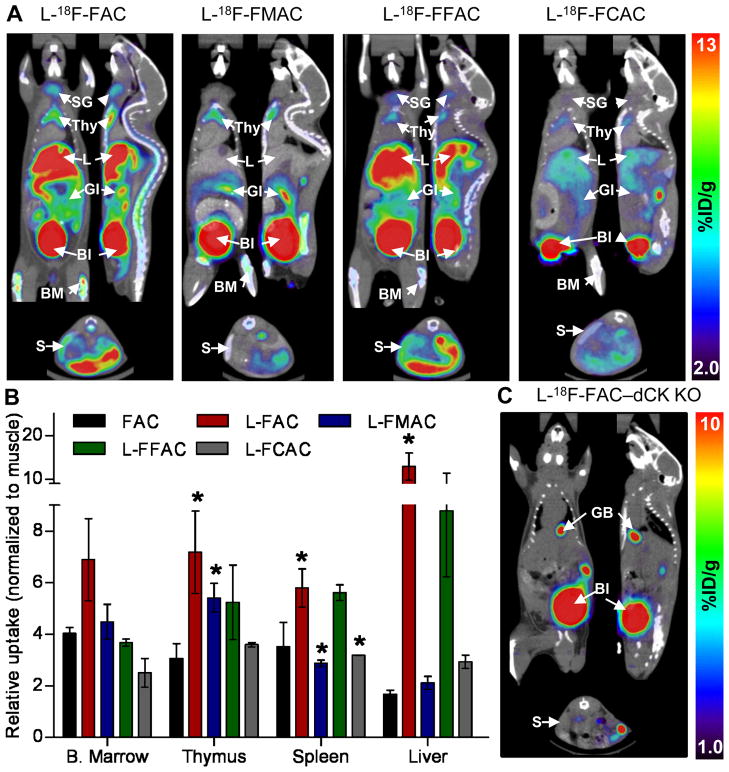
FIGURE 5. Biodistribution of the 18F-labeled unnatural nucleosides in mice.
(A) MicroPET/CT scans of C57/BL6 mice; Bl, bladder; BM, bone marrow; GI, gastrointestinal tract; L, liver; S, spleen; SG, salivary gland; Thy, thymus. (B) Quantification of PET imaging data. Probe uptake was normalized to the muscle background (absolute uptake values are shown in Supplemental Figure 6). (P values are calculated relative to FAC for each specific tissue. * = P<0.05, n=5 (18F-FAC), n=3 (L-18F-FAC), n=3 (L-18F-FMAC), n=2 (L-18F-FFAC), n=2 (L-18F-FCAC)). (C) L-18F-FAC microPET/CT scan of a dCK knockout mouse.

