
Figure 8.
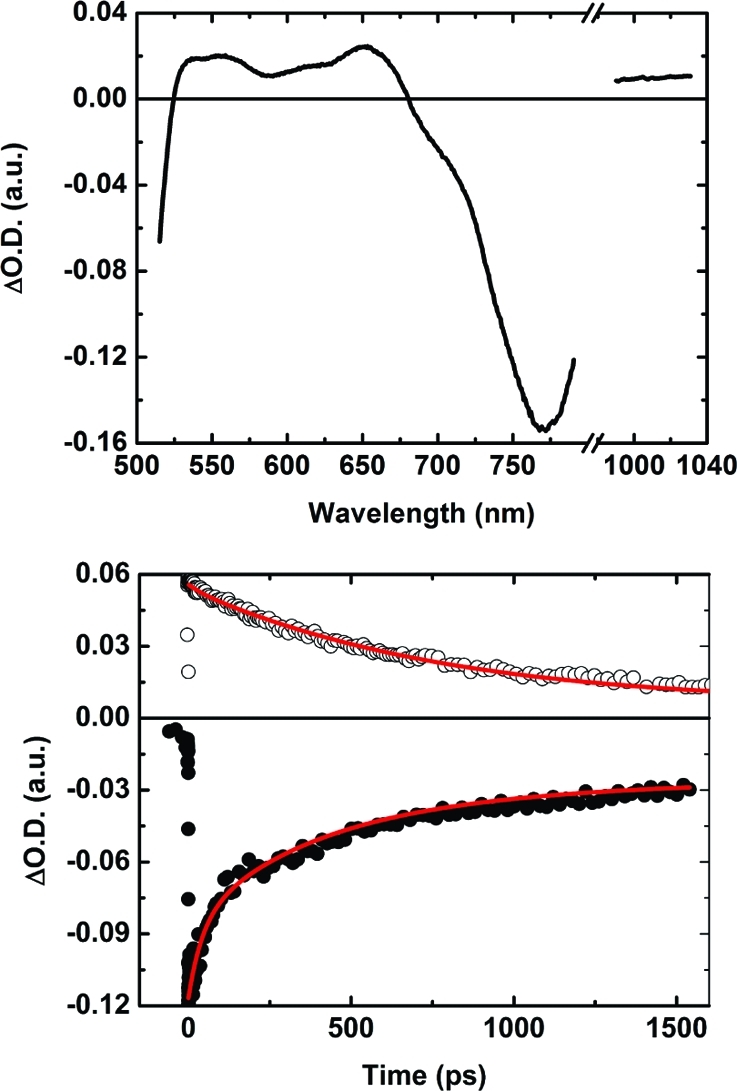
(top) Femtosecond transient absorption spectra of P3–C60 at 200 K for a delay time of 75 ps. The NIR part of the spectrum was collected with probe light from an OPA and the visible part with a white-light continuum. (bottom) Transient absorption decay at 1015 nm (○; multiplied by a factor of 5 for better visibility), where the C60•– and P3•+ species dominate the absorption, and at 730 nm (●), showing the recovery of the Q-band absorption. The red solid lines show fits of the transient absorption decays.