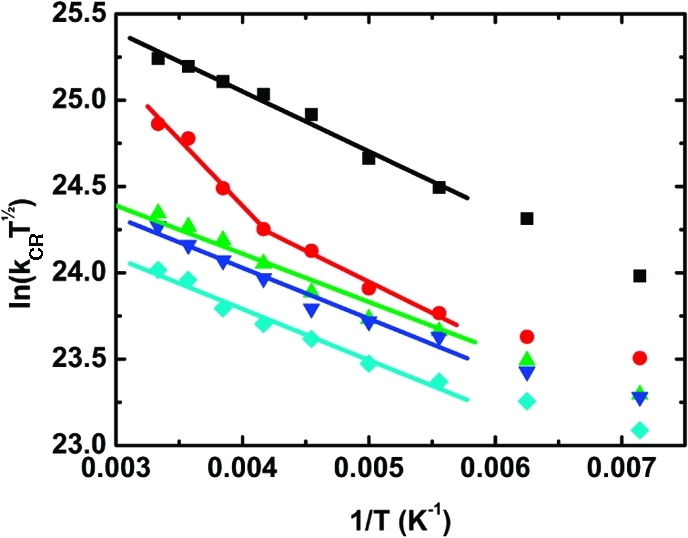
Figure 9.

Plots of ln(kCRT1/2) vs 1/T for P1–C60 (black), P2–C60 (red), P3–C60 (green), P4–C60 (blue), and P6–C60 (cyan). The samples were excited at 495 nm, and the rate constants were derived from the transient absorption decays (kCR = 1/τ). The lines are fits to the linearized form of eq 2.
