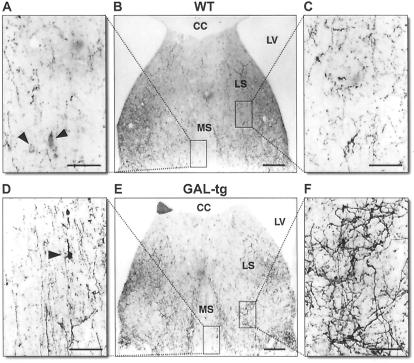
Figure 4.
Photomicrographs of the septal region of a WT (A–C) and GAL-tg (D–F). (A) High-power image of the medial septal region showing scattered thin galanin-containing fibers in a WT. Note the lightly labeled galanin-containing cell bodies (arrowheads). (B) Low-power image of septal region in a WT. Boxes indicate the regions from which high-power photomicrographs were taken. (C) High-power image of the lateral septum in a WT. (D) High-power photomicrograph of thickened galanin-containing fibers in the medial septal region of a GAL-tg. Note the darkly labeled galanin-containing neuron (arrowhead). (E) Low-power image of septal region in a GAL-tg. Boxes indicate the regions from which high-power photomicrographs were taken. (F) High-power image showing thickened and twisted galanin-containing fibers in the lateral septum of a GAL-tg. These are similar to those seen in patients with AD. CC, corpus callosum; CD, caudate nucleus; LS, lateral septum; LV, lateral ventricle; MS, medial septum. (Bars: A, C, D, F = 50 μm; B and E = 200 μm.)

