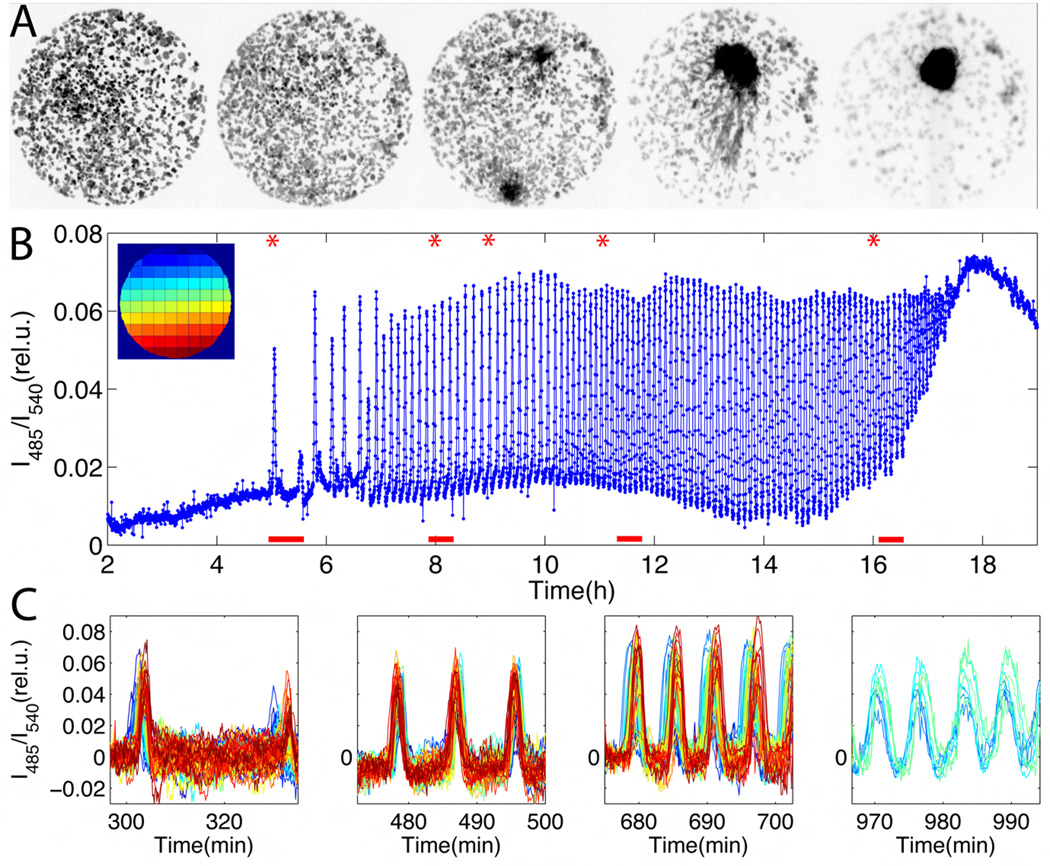
Fig. 1.
Live-cell imaging of cAMP signaling during early development of Dictyostelium discoideum cells. (A) Approximately 180 cells are confined to a 420 µm diameter area on hydrophobic agar (SOM). Snapshots are taken at times indicated by the red asterisks in (B). Dark area in right-most snapshot corresponds to final aggregation site of the population. (B) Time course of changes in FRET efficiency, averaged over all cells (time indicates hours after starvation). The fluorescent intensities of the CFP-channel divided by that of the YFP-channel are plotted on y-axis. The upper left inset is a colored schematic for the sub-regions analyzed in (C). (C) Close-ups of the time-series for each sub-region, containing 0–5 cells. Red bars indicate time windows in (B), chronologically ordered from left to right. Colors correspond to the colors of the spatial regions displayed in the inset in (B). Small differences in the rising phase of the pulses for individual regions correspond to cAMP waves that are propagating in space (see also fig. S7).

