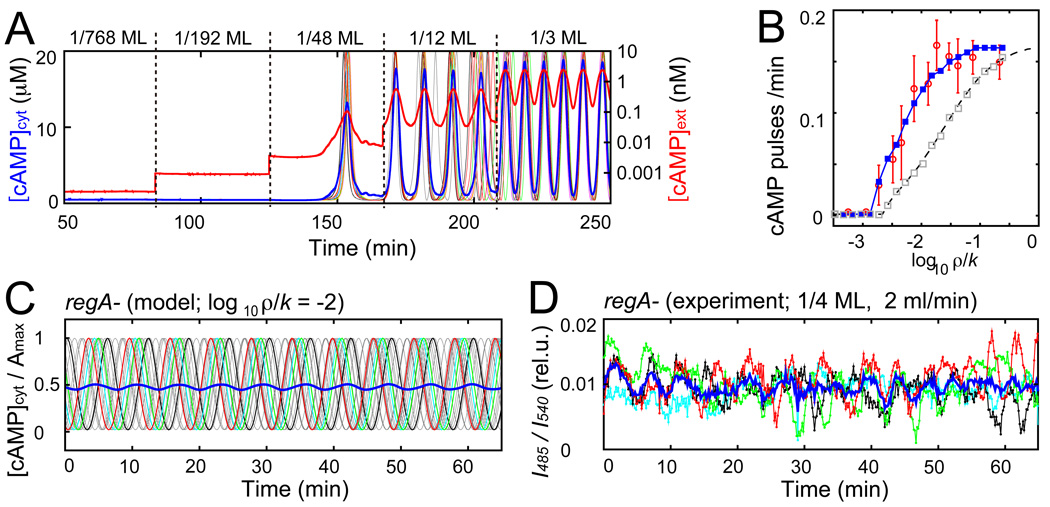
Fig. 4.
Dynamical quorum sensing-type transition in a population of excitable/oscillatory switch elements. (A) Representative simulated time courses of average cAMP concentrations (cytosolic [cAMP]cyt and extracellular [cAMP]ext in linear and logarithmic scales, respectively). Thin colored lines indicate [cAMP]cyt in individual cells. Cell densities are raised in incremental steps of 1/768ML, 1/192ML, 1/48ML, 1/12ML, and 1/3ML at k = 5ml/min. (B) Firing rate as a function of ρ/k as predicted by the coupled phase model with (blue line; Eq. S5) or without (grey squares; eq. S5) incorporation of stochastic pulsing. For comparison: experimental data from Fig. 2C (red circle) and mean-field approximation (dashed black line; eq. S6). (C) Model prediction of de-synchronization at elevated cytosolic cAMP levels (Amax and Abas increased 10 times; eq. S1). [cAMP]cyt normalized by Amax in individual cells (thin gray lines; four cells are highlighted by colors). Blue line indicates population average. (D) Poorly synchronized population-level oscillations in regA- mutants whose degradation of intracellular cAMP is reduced (1/4 ML; 2mL/min). Colors indicate average signals by cells in four 100µm × 100µm regions separated by ~150µm. Blue line indicates average of the four regions.

