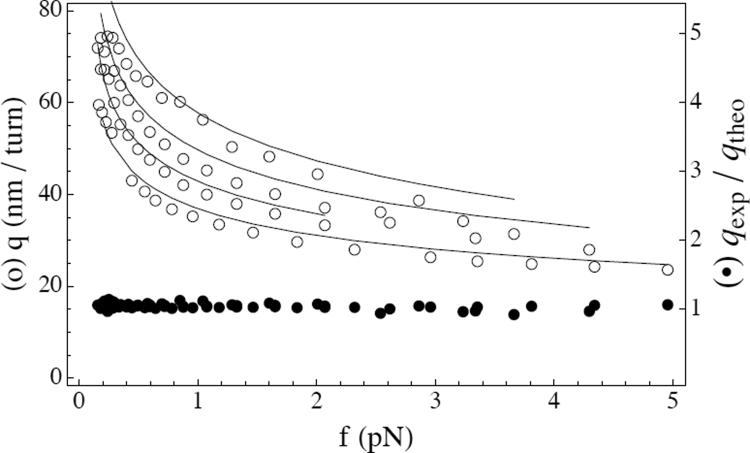
FIG. 2.
Comparison of experimental and theoretical slopes as function of the applied force, for 50, 100, 200, and 500 mM salt (top to bottom): (a) experimental data from Ref. [1] (circles); (b) theoretical solution of the full equations (continuous lines); (c) ratio of the experimental slopes to the formula in Eq. (16) (filled circles). Experimentally given values of A/kT = 46, 47, 44, 45 nm and C/kT = 94 nm were used.

