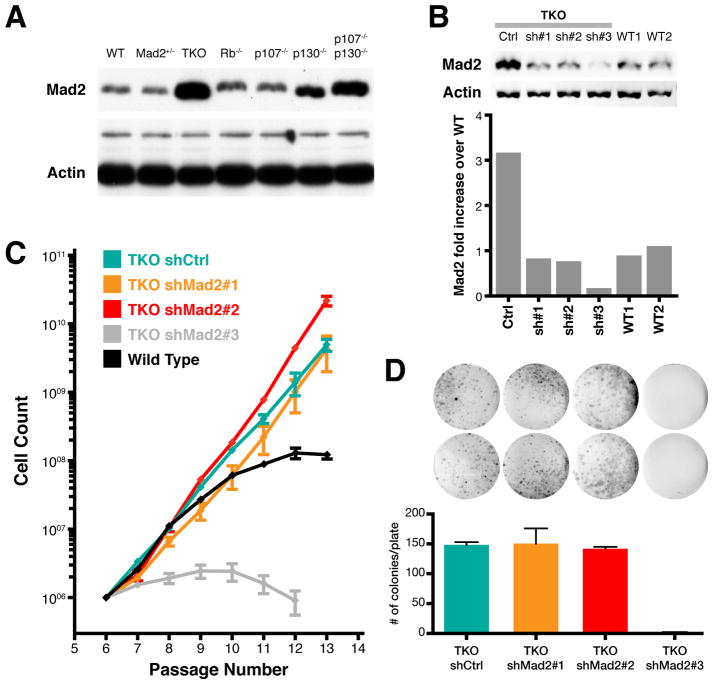
Figure 3. Normalization of Mad2 levels in TKO MEFs.
(A) Western blot showing Mad2 levels in wild-type (WT), Mad2 heterozygote (Mad2+/−), and Rb, p107 and p130 triple (TKO), single and double p107 and p130 knockout MEFs. Actin and a larger molecular weight non-specific band serve as a loading control.
(B) Western blot and quantification of Mad2 levels in wild-type (WT1 and WT2) and TKO MEFs transduced with lentiviral vectors expressing sh-scrambled control (Ctrl), sh-Mad2#1, sh-Mad2#2 and sh-Mad2#3. Levels are normalized to Actin.
(C) 3T3 proliferation assay for TKO MEFs transduced with corresponding short hairpin lentiviral vectors. Averages ± SD of two independent experiments are shown.
(D) Colony formation assay and quantification of colonies for TKO Control, shMad2#1, shMad2#2 and shMad2#3 vectors. Averages ± SEM of two independent experiments are shown (p < 0.002 for shMad2#3, all others p > 0.4; unpaired t-test).
See also Figure S3.

