
Figure 4.
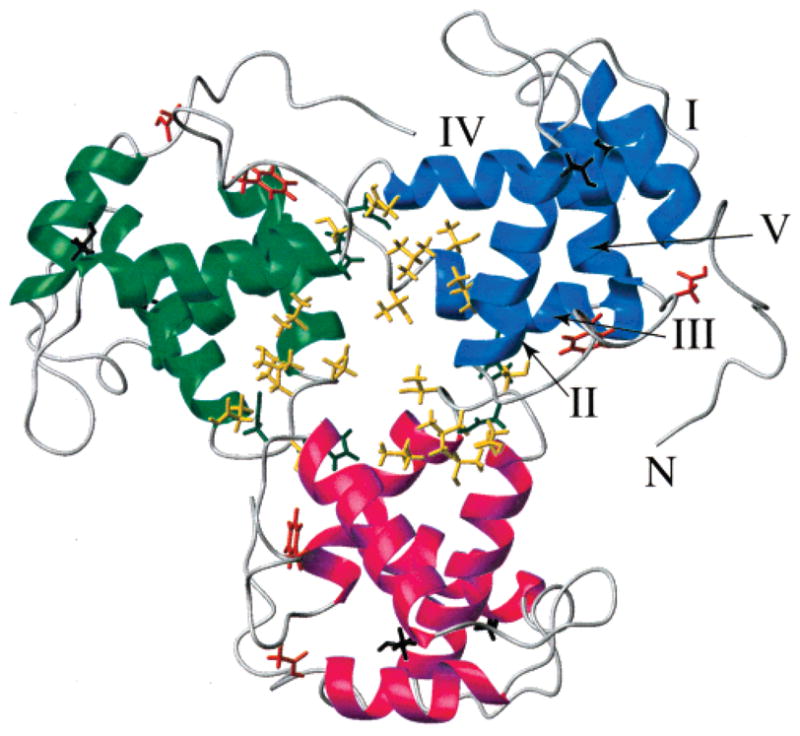
Residues exhibiting concentration-dependent chemical shifts mapped onto the trimer model of EIAV MA. Each monomer is colored differently. Helices are labeled for one monomer. Strongly perturbed residues have their side chain bonds displayed. Residues H41 and D42 are colored dark green. Residues V63, T64, T66, L67, S68, and E71 are colored gold. Residues F45 and D50 are colored orange-red. Residues T27 and S100 are colored black.