Figure 1.
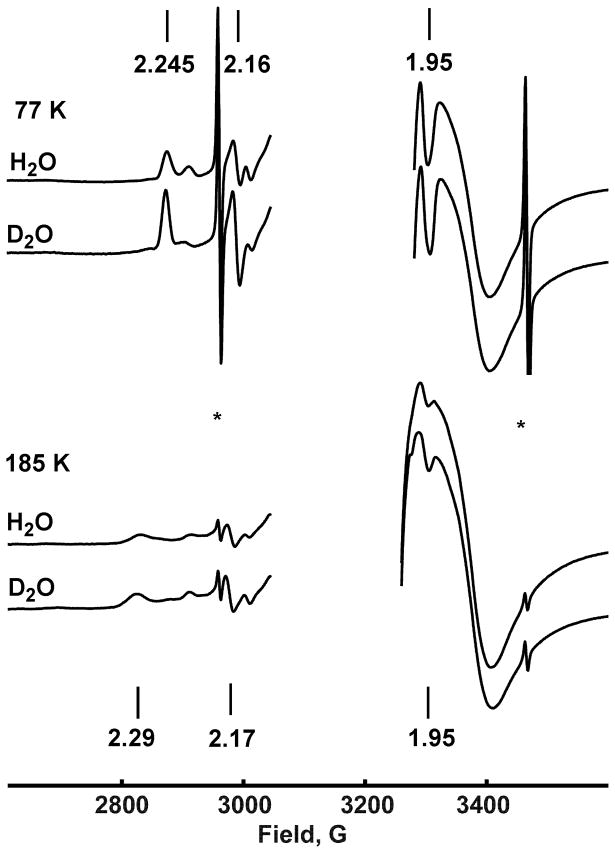
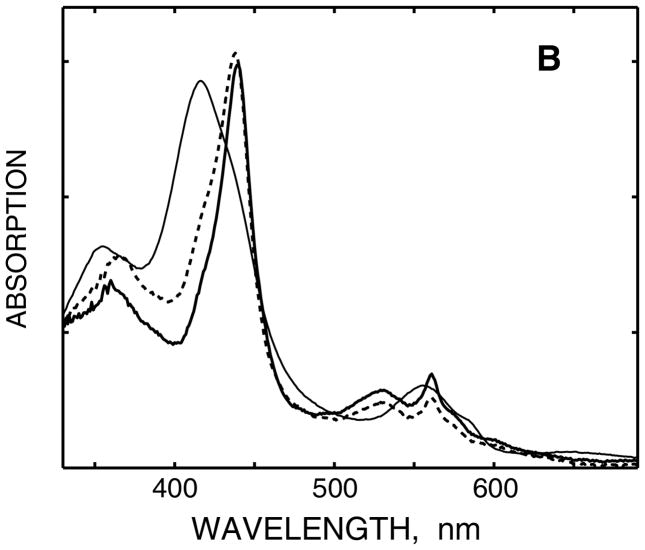
(A) EPR spectra of the reduced oxy-ferrous complex of D251N CYP101. Data measured after irradiation at 77 K, and after all resonance Raman experiments and annealing at 185 K. The hydrogen atom doublet is marked by the star sign. Vertical bars indicate the features of peroxo-ferric (upper line) and hydroperoxo-ferric (bottom line) complexes with the corresponding g-values. Frozen samples are in 100 mM phosphate (H2O or D2O, as indicated), 100 mM KCl, 30% glycerol v/v, T = 15 K. Other details of EPR spectroscopy are described in Materials and Methods. (B) Absorption spectra of D251N CYP101: (1) Oxy-ferrous complex, T=85 K, before irradiation; (2) peroxo-ferric complex, 90 K, after irradiation at 77 K; (3) hydroperoxo-ferric complex, 180 K, after irradiation at 77 K and annealing at 185 K. Frozen samples are in 100 mM phosphate (H2O), 100 mM KCl, pH 7.4, 65% glycerol.


