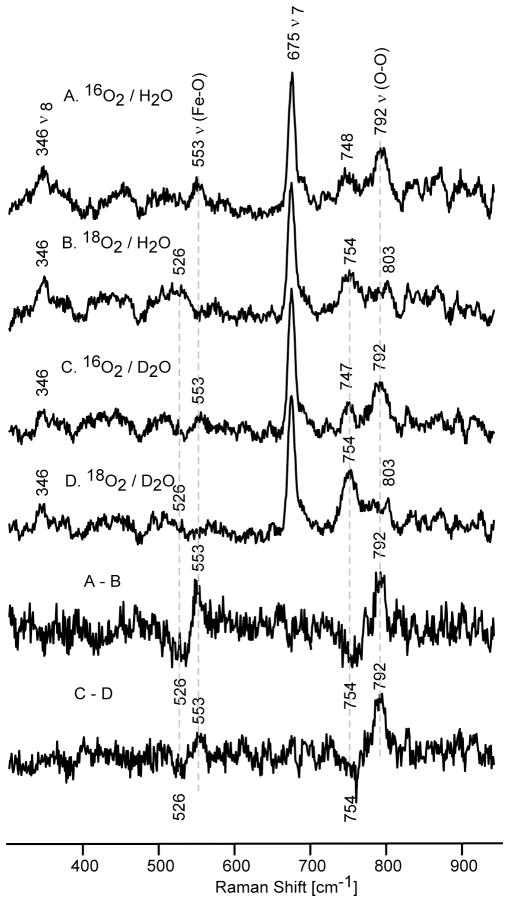
Figure 3.
Theresonance Raman spectra of irradiated P450 D251N samples in H 2O buffer: spectra A (16O2) and B (18O2) and in the D2O buffer: spectra C (16O2) and D (18O2). The two bottom traces shows the difference spectra of 16O2-18O2 in H2O and 16O2-18O2 in D2O buffer (excitation line 442 nm, temperature 77 K).

