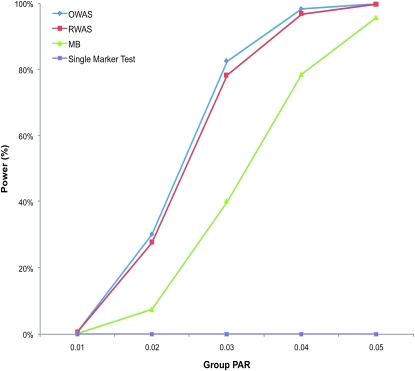
Figure 1.—
Power comparison in the constant PAR model. There are five group PAR levels (1%, 2%, 3%, 4%, and 5%), and for each group PAR, 10,000 data sets were generated. Each data set contained 1000 case and 1000 control individuals having 100 variants (50 D variants and 50 N variants). Four different methods (RWAS, OWAS, MB, and the single-marker test) were tested, and their power was estimated as the number of significant data sets among the 10,000 data sets using a significance threshold of 2.5 × 10⁻⁶.

