
Figure 2. Cellular toxicity and chaperone expression for the HSP90 inhibitors.
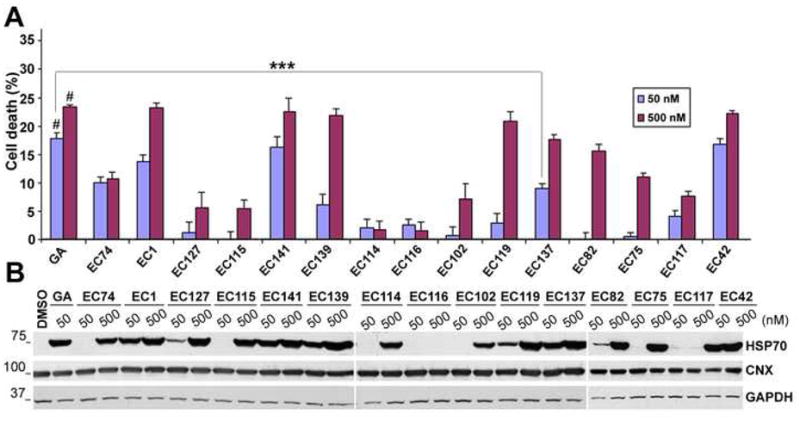
(A) Non-myelinating rat SCs were treated with DMSO (control) or HSP90 inhibitors at 50 and 500 nM concentrations for 16 h and then incubated in MTT (0.5 mg/ml) for 5 h at 37 °C. The toxicity of the test compounds was determined from three independent experiments with respect to DMSO treated control cells, which was set at 0 % cell death (***p<0.001 and #p<0.001 with respect to DMSO control). Error bars indicate SEM. (B) The levels of HSP70 and calnexin (CNX) were determined by Western blot analyses in total cell lysates (20 μg/lane) after 16 h treatment. GAPDH is shown as a protein loading control. Molecular mass in kDa.