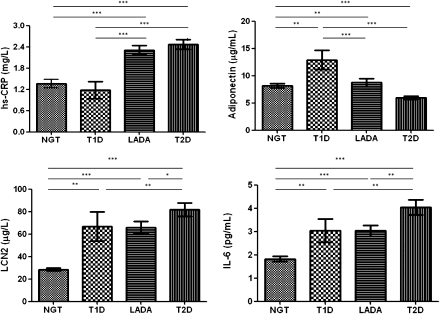
Figure 1.
Cytokine levels in subtypes of diabetes and normal subjects. Univariate of general linear model adjusted according to age, sex, and BMI between groups. *P < 0.05, **P < 0.01, ***P < 0.001. NGT, normal glucose tolerance subjects; T1D, type 1 diabetic subjects; T2D, type 2 diabetic subjects.

