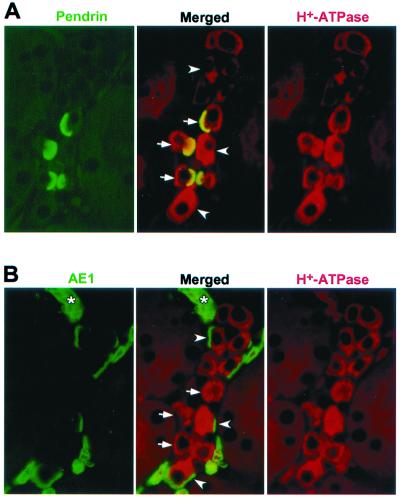
Figure 5.
Localization of pendrin relative to other proteins in mouse kidney. Paraformaldehyde-fixed, paraffin-embedded mouse kidney sections were double-labeled with the monoclonal antibody E11 to H+-ATPase (red; undiluted) and either the anti-pendrin polyclonal antibody h766–780 (green; 1:1000) or an anti-AE1 antibody (green, 1:500). The micrographs shown in A and B reflect identical areas of two serial sections (2 μm each). When comparing the merged images in A and B, note the different subpopulations of cells staining for pendrin (arrows) and AE1 (arrowheads). Also note that some intercalated cells are negative for both pendrin and AE1. The asterisk indicates red blood cells staining only for AE1. (Original magnification ×1000).

