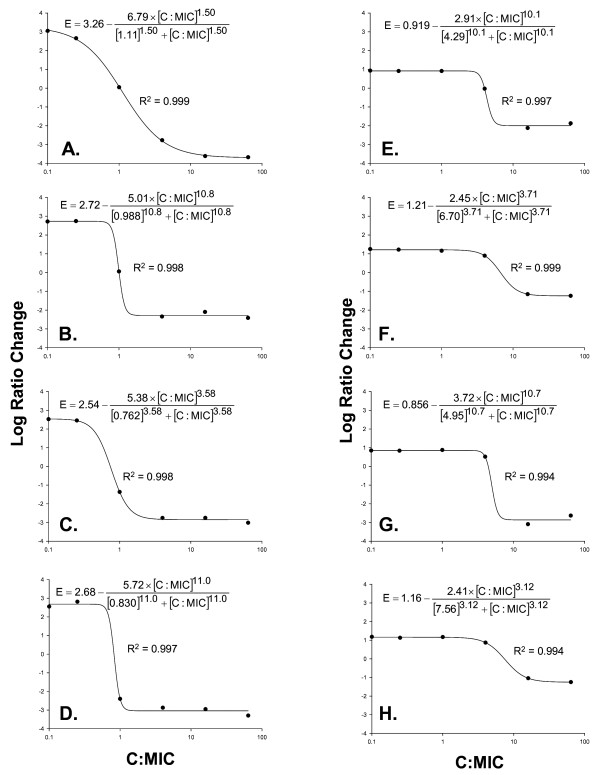
Figure 2.
Pharmacodynamic relationship evaluating vancomycin concentration to minimum inhibitory concentration ratio (C:MIC) and change in log10 CFU/ml at 24 hours (Log Ratio Change) among agr functional HA-MRSA 7 (A,E), agr dysfunctional HA-MRSA 9 (B,F), agr functional CA-MRSA 26 (C,G), and agr dysfunctional CA-MRSA 20 (D,H) at low and high initial inoculum (106, 108 log10 cfu/ml). R2: Coefficient of Determination. Data are reported as maximum likelihood model fitted parameter estimates from equation 2 for each strain.

