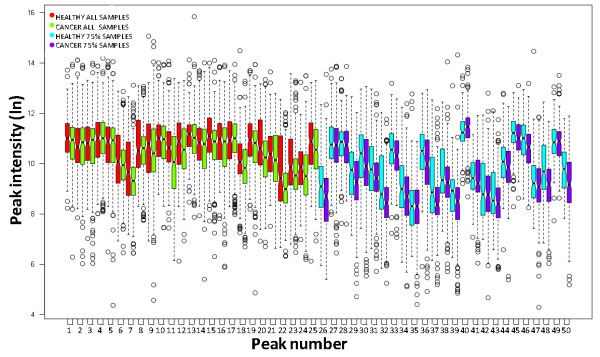
Figure 4.
Intensity distribution of plasma LC-MS peptide peaks. Example intensity distributions are shown for 25 randomly selected LC-MS peaks found in each of 420 plasma samples (peaks 1-25, red and green boxes) and 25 randomly selected peaks found in at least 75% of all plasma samples (peaks 26-50, blue and purple boxes). The dark center line in each box represents the median intensity for each peak and the surrounding box contains the interquatrile (+/- 25%) of the data points for that peak. The whiskers show peaks with intensities up to two standard deviations from the median; circles represent peak intensities from these 420 plasma samples that are outside of this range.

