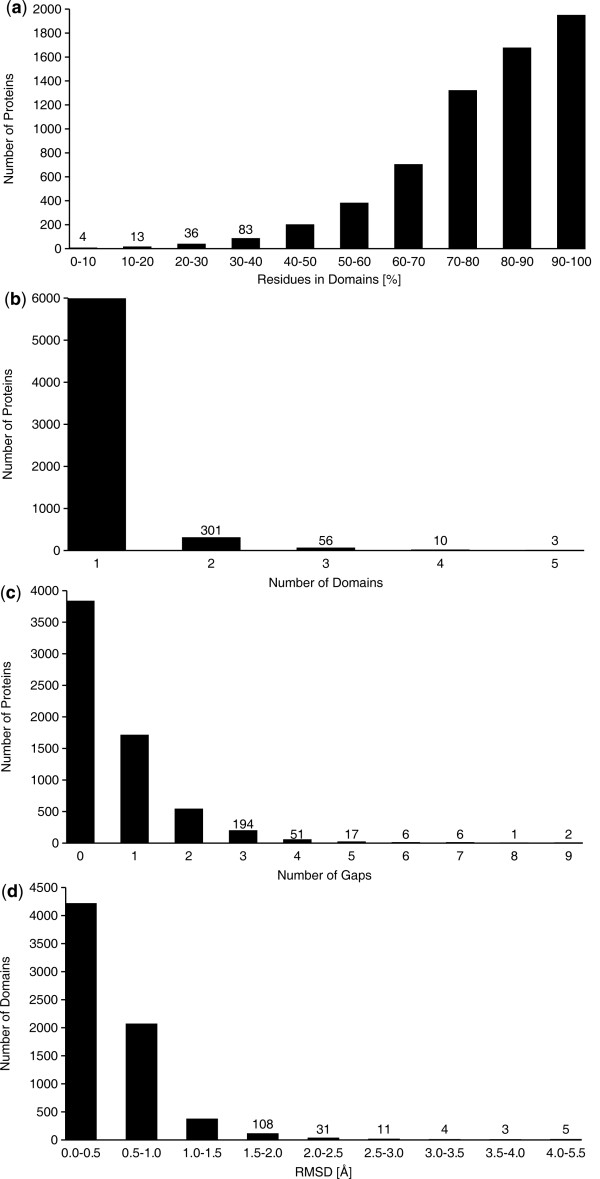
Figure 6.
Application to all NMR structures in the PDB. Statistics of residue ranges determined with the CYRANGE algorithm for 6351 NMR protein structure bundles in the Protein Data Bank as of July 2010. (a) Percentage of residues in the residue range(s). (b) Number of domains. (c) Number of intra-domain gaps between the residue ranges. (d) RMSD values for the residue range.

