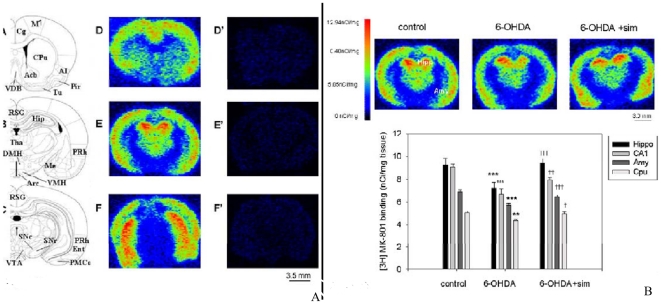
Figure 2.
2A.[3H] MK-801 autoradiography depicts the expression of NMDA receptors in the rat brain. The maps of A, B and C are adopted from a rat brain atlas indicating the levels where the [3H]MK-801 binding density was measured. Autoradiographs (D, E, F) and (D', E', F') depict the expression of [3H]MK-801 binding and non-specific [3H]MK-801 binding at different rostro-caudal coronal levels of the rat brain. 2B. Typical autoradiographs depict the expression of NMDA receptors in the hippocampus (Hipp) and amygdala (Amy) among control, 6-OHDA-lesioned rats, and 6-OHDA lesioned rats that also received simvastatin treatment. The bar chart shows the effects of chronic simvastatin treatment on [3H]MK-801 binding in the different groups of rat brain regions. Note: Units of measurement are in nCi/mg tissue. Data are means ± SEM. Asterisks indicate significant differences from control group (saline) and cross indicates significant differences between 6-OHDA rats and 6-OHDA with simvastatin-treated rats (n = 6–8, **p<0.01; ***p<0.001; †p<0.05; ††p<0.01; †††p<0.001, one-way ANOVA followed by Tukey's test).

