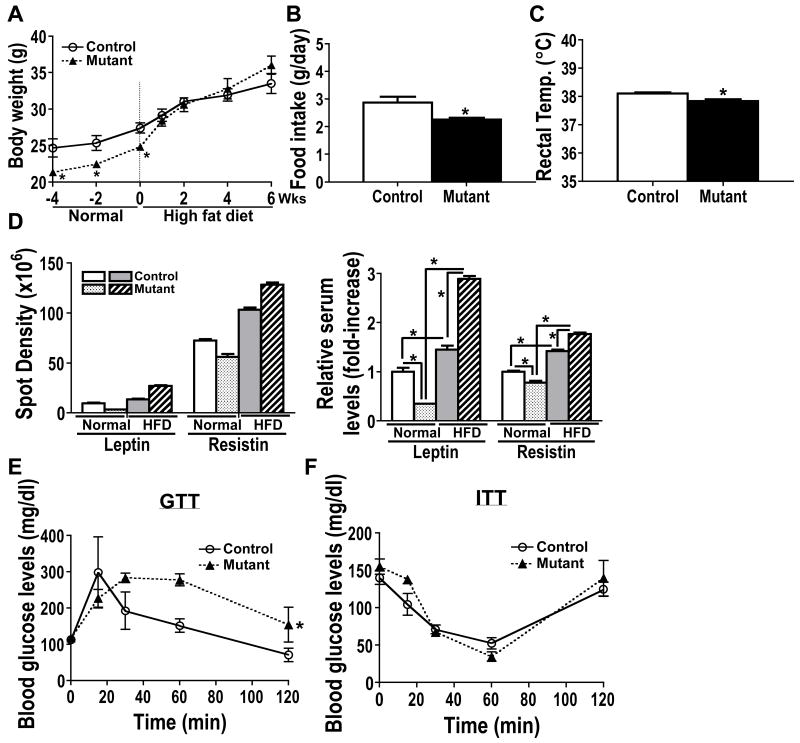
Fig. 3.
A. Osteoblast-specific Capns1 knockout mutant mice showed reduced body weight compared with control mice on a normal chow diet. The average body weight of the mutant mice became indistinguishable with that of the control mice after a 2-week high fat diet, and continued to show its upward trend compared with that of the controls up to 6 weeks. B and C. The average food intake (B) and rectal temperature (C) of the mutant mice were lower than those of the control mice under a high fat diet. D. A high fat diet increased serum levels of leptin and resistin in both control and mutant mice, but the effect was significantly greater in mutant mice than controls. The average spot density of serum adipokine levels was semi-quantified using FluorChem SP. Left panel shows an actual average reading of spot density of an adipokine. Right panel shows an average relative spot density of an adipokine. An average spot density of an adipokine of control mice on a normal chow diet was set as 1. E. Glucose tolerance test (GTT). Mutant mice on a high fat diet for 6 weeks showed impaired glucose tolerance compared with control littermates in i.p. GTT. F. Insulin tolerance test (ITT). No difference was found between control and mutant mice in i.p. ITT. Statistical analysis of GTT and ITT were performed using repeated measurement of two-way ANOVA. *, p<0.05.

