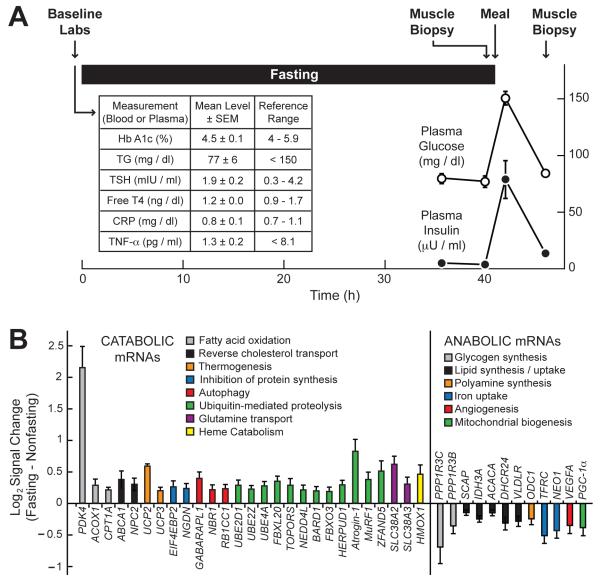
Figure 1. Effect of Fasting on Skeletal Muscle mRNA Expression in Healthy Human Adults.
(A) Study design. The table (insert) shows baseline circulating metabolic and inflammatory markers. The graph shows plasma glucose and insulin levels. Data are means ± SEM from the seven study subjects. In some cases, the error bars are too small to see. (B) Representative fasting-responsive human skeletal muscle mRNAs, and the effect of fasting on their log2 hybridization signals, as assessed by Affymetrix Human Exon 1.0 ST arrays. In each subject, the fasting signal was normalized to the nonfasting signal from the same subject. Data are means ± SEM from 7 subjects. P ≤ 0.02 by paired t-test for all mRNAs shown. The complete set of 558 fasting-responsive mRNAs is shown in Table S1. See also Figure S1.

