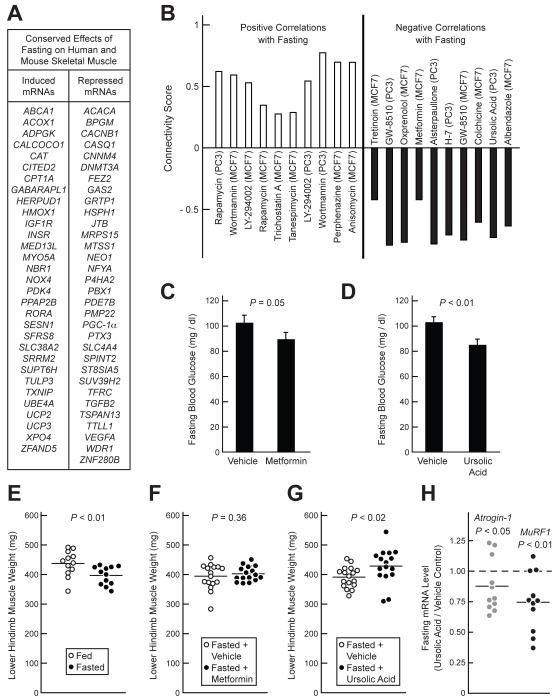
Figure 2. Identification of Ursolic Acid as an Inhibitor of Fasting-Induced Skeletal Muscle Atrophy.
(A) Fasting-regulated mRNAs common to human and mouse muscle that were used to query the Connectivity Map. Inclusion criteria were: P ≤ 0.02 in fasted human muscle (by t-test), P ≤ 0.05 in fasted mouse muscle (by t-test), and the existence of complimentary probes on HG- U133A arrays. (B) Connectivity Map instances (or datasets), sorted by compound and cell line, with the most significant positive and negative correlations to the effect of fasting in human and mouse muscle. The connectivity score, represented on the y-axis, is a measure of the strength of the correlation (Lamb et al., 2006). P < 0.004 for all compounds shown. (C-D and F-H) Mice were administered metformin (250 mg / kg), ursolic acid (200 mg / kg) or an equivalent volume of vehicle alone via i.p. injection, and then fasted. After 12 hours of fasting, a second injection of metformin, ursolic acid or vehicle was administered. After 24 hours of fasting, the blood glucose was measured and muscles were harvested. (C-D) Effect of metformin (C) and ursolic acid (D) on fasting blood glucose. Data are means ± SEM from 16 mice. (E) Effect of 24 h fast (relative to ad lib feeding) on wet weight of lower hindlimb skeletal muscle (bilateral tibialis anterior (TA), gastrocnemius, and soleus). (F-G) Effect of metformin (F) and ursolic acid (G) on fasted lower hindlimb muscle weight. (H) Effect of ursolic acid on atrogin-1 and MuRF1 mRNA levels in the TA muscles of fasted mice. The data are normalized to the levels in vehicle-treated mice, which were set at 1. (E-H) Each data point represents one mouse and the horizontal bars denote the means. (C-H) P-values were determined using unpaired t-tests. See also Table S2.

