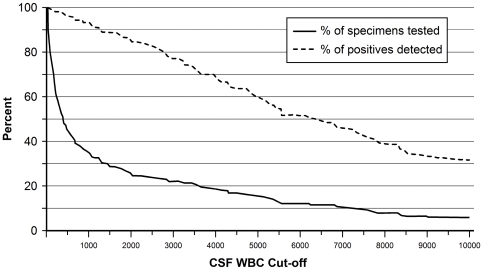
Figure 3. Relationship between minimum CSF WBC count used as a cut-off to determine what specimens are tested by RT-PCR and 1) the proportion of the total RT-PCR positives (n = 122) that are identified (dashed line) and 2) the proportion of all specimens (n = 481) that would be tested (solid line).
For example, if only those specimens with a CSF WBC of at least 1000 had been tested, about 34% of the 481 CSF specimens would have been tested, which would have detected about 92% of the 122 specimens that were RT-PCR positive. Data were censored at a CSF WBC cut-off of 10,000. Data are for culture-negative and culture unknown specimens. Includes 188 patients with unknown culture results.

