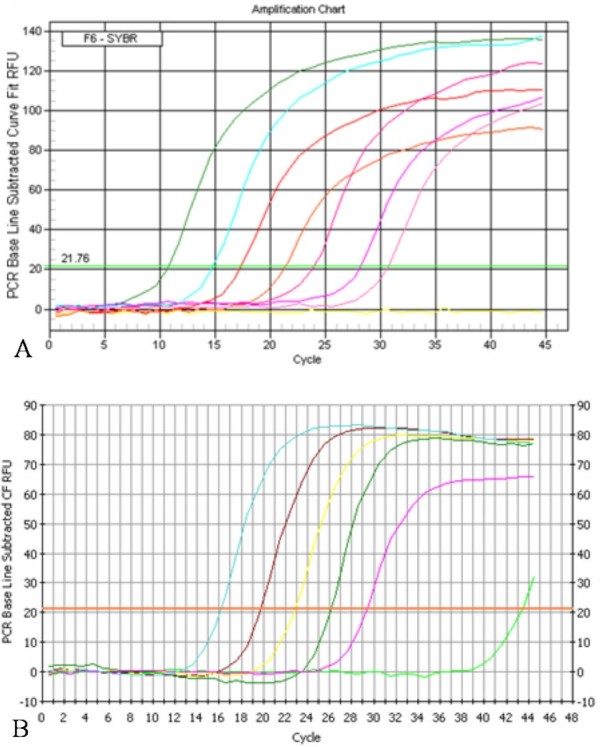
Figure 3.

The amplication curves of DEV UL55 gene and β-actin by qRT-PCR. A, Ten-fold dilutions of standard pMD18-T/UL55 ranging from 1.0 × 10⁻⁷ to 1.0 × 10⁻¹ copies/reaction were used for amplification, as indicated in the x-axis, whereas the corresponding Ct values are presented on the y-axis. B, Ten-fold dilutions of standard pMD18-T/β-actin ranging from 1.0 × 10⁻⁸ to 1.0 × 10⁻⁴ copies/reaction were used for amplification, as indicated in the x-axis, whereas the corresponding Ct values are presented on the y-axis.
