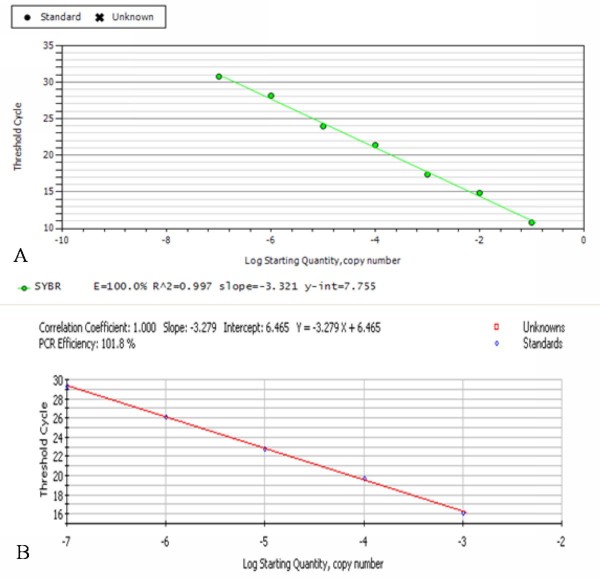
Figure 4.
The standard curves of DEV UL55 gene and β-actin by qRT-PCR. A, The standard curve of DEV UL55 gene was calculated by iCycler IQ 5 software. Each dot represents the result of triplicate amplification of each dilution. The standard curve equation is Y = -3.321X + 7.755, the correlation coefficient and the slope value of the regression curve were calculated and indicated. B, The standard curve of reference gene β-actin was calculated by iCycler IQ 5 software. Each dot represents the result of triplicate amplification of each dilution. The standard curve equation is Y = -3.279X+6.465, the correlation coefficient and the slope value of the regression curve were calculated and indicated.

