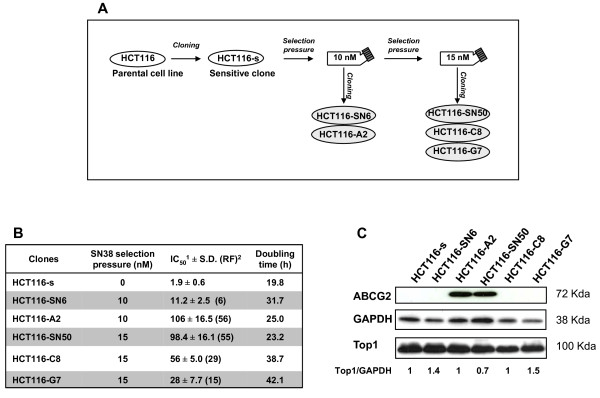
Figure 1.
Generation and characterization of SN38-resistant HCT116 cells: A) Schematic representation of the production of SN38-resistant HCT116 cell clones. B) Drug sensitivity and growth rate of the HCT116 clones: IC50 values were determined using the Sulforhodamine B assay; the resistance factor (RF; in between brackets) was determined by dividing the IC50 value of each resistant clone by that of the sensitive clone HCT116-s. Data represent the mean ± SD of at least 3 independent experiments. Doubling time was calculated during the exponential growing phase as following: doubling time (in hours) = h*ln(2)/ln(c2/c1); c1 and c2 are the cell concentration at the beginning and the end of the chosen period of time C) TOP1 and ABCG2 protein expression by western blotting. Equal loading is shown by GAPDH. Values below the blot represent relative quantization of TOP1.

