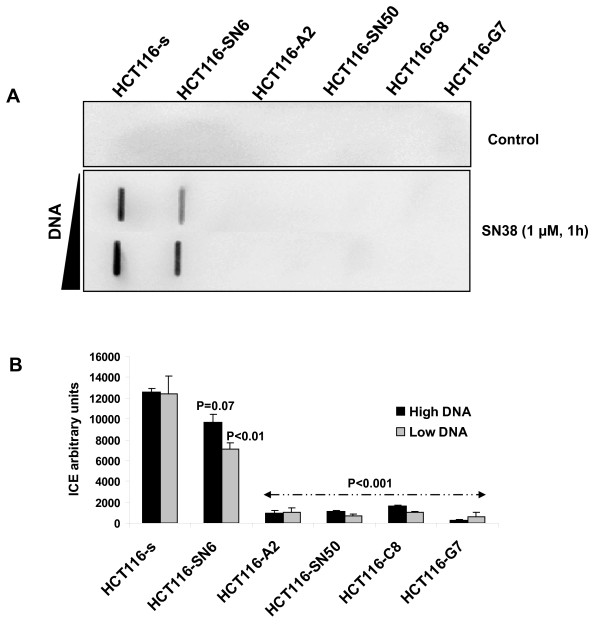
Figure 3.
CPT-11-induced TOP1-DNA complexes: A) TOP1-DNA cleavage complexes measured using the ImmunoComplex of Enzyme (ICE) assay in nuclear extracts (two concentrations were used) of SN38 sensitive and resistant HCT116 cells following treatment with SN38 (1 μM, 1 h). B) Quantification of TOP1-DNA complexes using Image J Software. The relative intensity of the immune complexes in SN38-treated cells was normalized to that of untreated cells. Vertical bars indicate the SD of three independent experiments. p-values less than 0.05 were considered statistically significant.

